Patent Index 2023
Digital and clean-energy technologies driving growth

Patent filings at the EPO were up 2.9%, as innovation accelerated in the areas of digital and green transformation. Europe's technology market remains attractive globally, with filings from P.R. China and R. Korea seeing the greatest absolute growth. The new Unitary Patent also proved popular with applicants around the world.
Insights 2023


Key figures
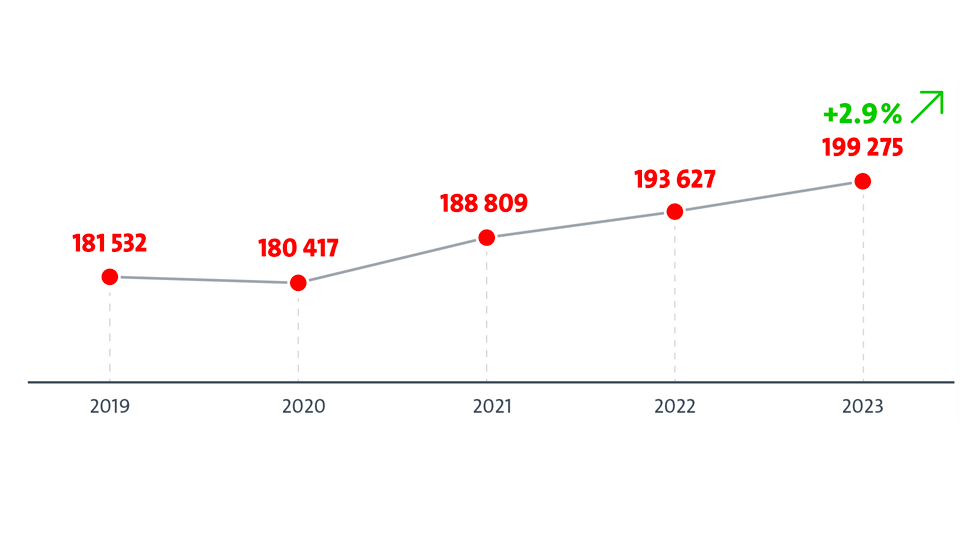
Continued growth in demand for European patents
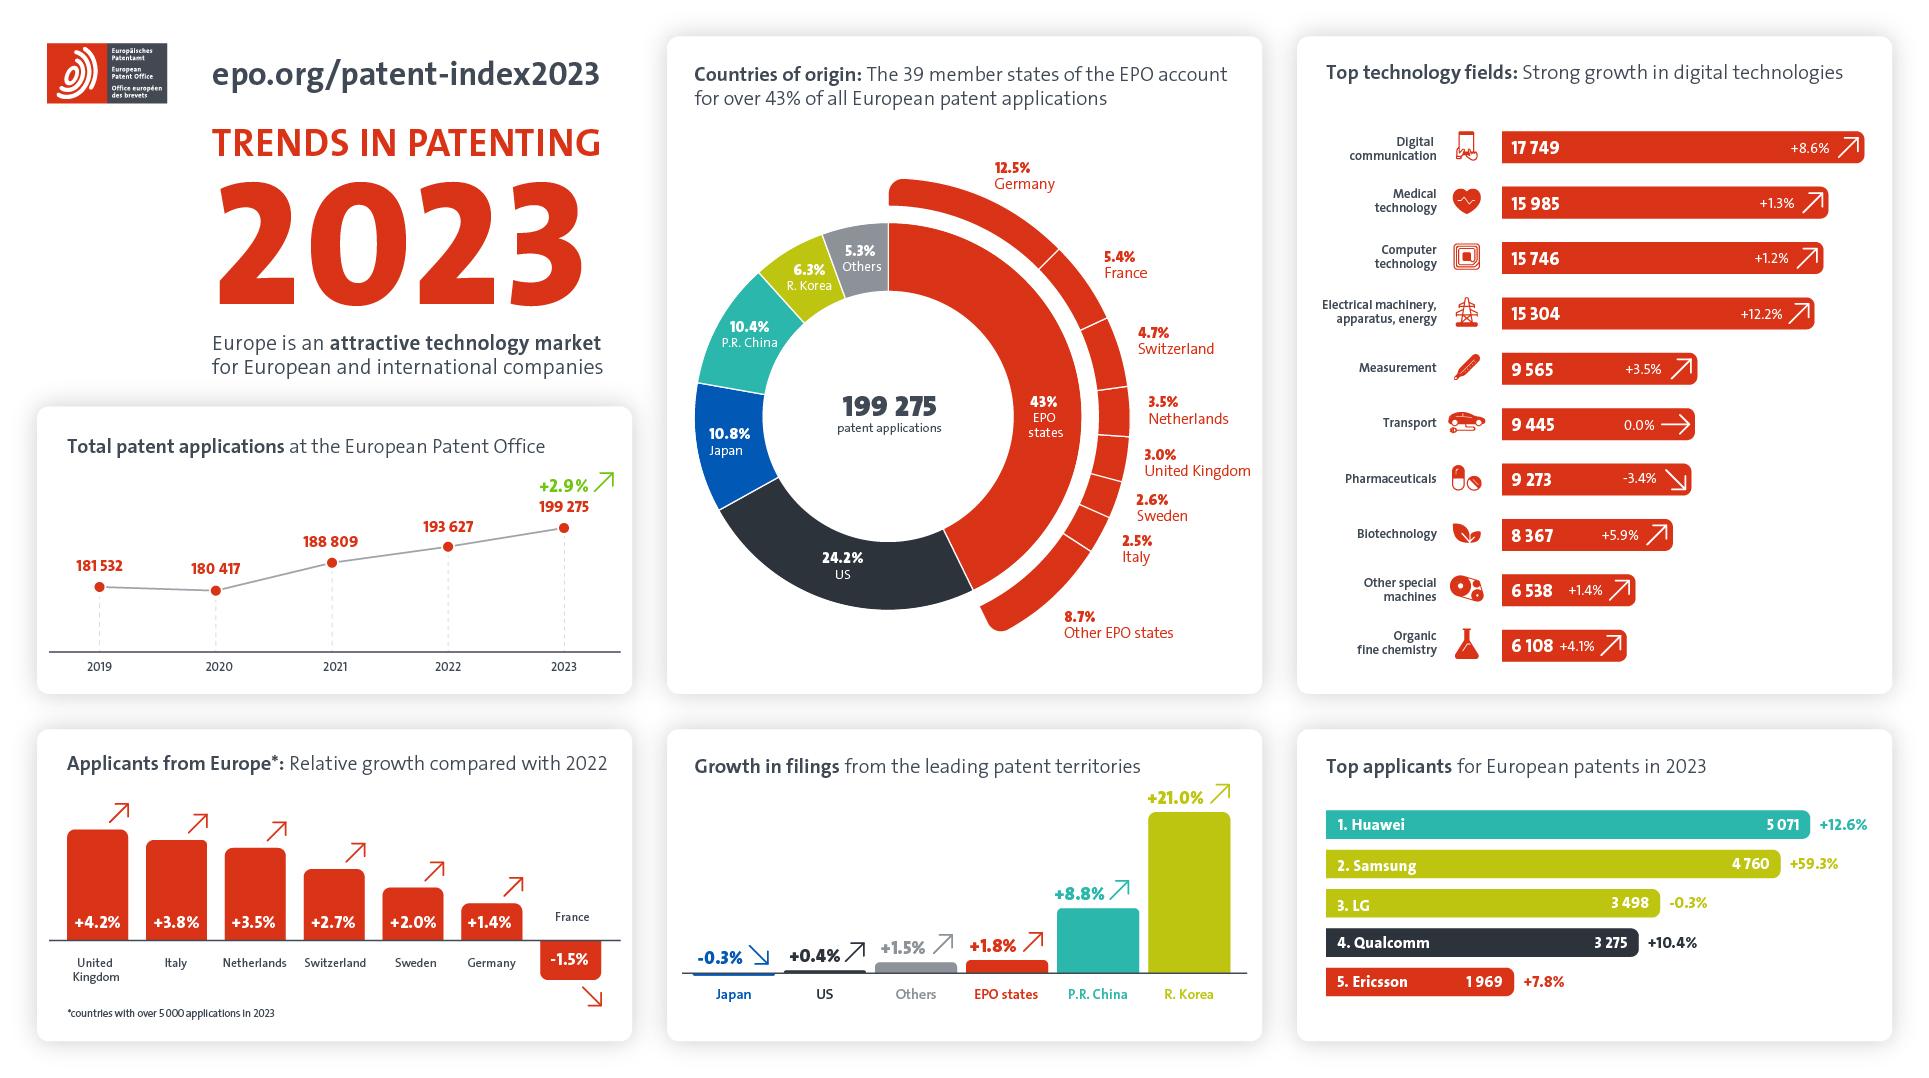
In 2023, the EPO received a record 199 275 applications. Innovation for tackling global challenges is on the rise, with many of the latest advances building on digital and green technologies for a healthier, more connected world. New synergies are emerging that cut across sectors, often driven by artificial intelligence and the need for cleaner, more energy-efficient solutions. While growth among European applicants remains steady, the increasing share of applications originating from outside Europe confirms the attractiveness of the European technology market for innovators globally.
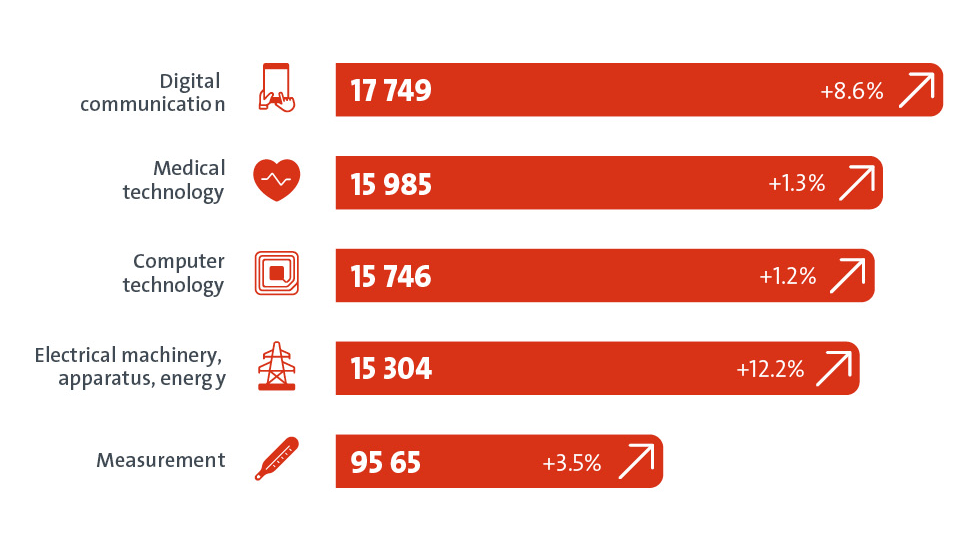
Top technology fields
Eight of the top ten most patent-active fields saw growth. Electrical machinery, apparatus and energy (+12.2%), a field that includes clean energy inventions and battery technologies, grew fastest. The top technology field of digital communication (+8.6%) saw strong growth, as did biotechnology (+5.9%). Filings remained robust in medical technology (+1.3%), computer technology (+1.2%) and measurement (3.5%), which includes sensors that are critical to the features of many smart devices. The combined number of filings in the top ten fields accounted for 57% of all European patent applications in 2023.
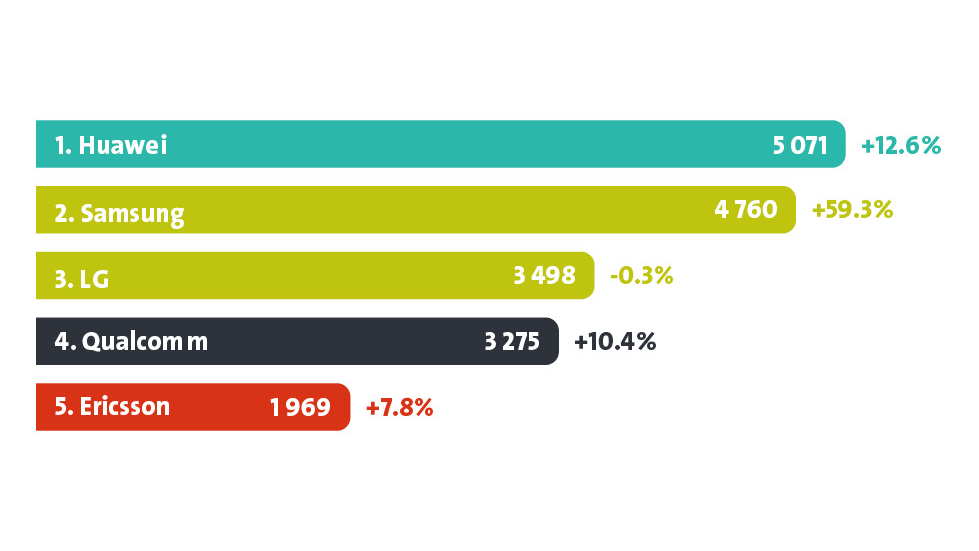
Top applicants
Huawei was once again the leading patent applicant at the EPO, accounting for a quarter of filings from P.R. China, followed by Samsung and LG, accounting for two thirds of filings from R. Korea. The top five was completed by Qualcomm and Ericsson. Overall, the top ten included four companies from Europe, two from Korea, two from the US, and one each from China and Japan. Meanwhile, almost one in four patent applications from Europe was filed by an individual inventor or small- to medium-sized enterprise. The share of filings from European universities and public research organisations increased slightly to 8%.
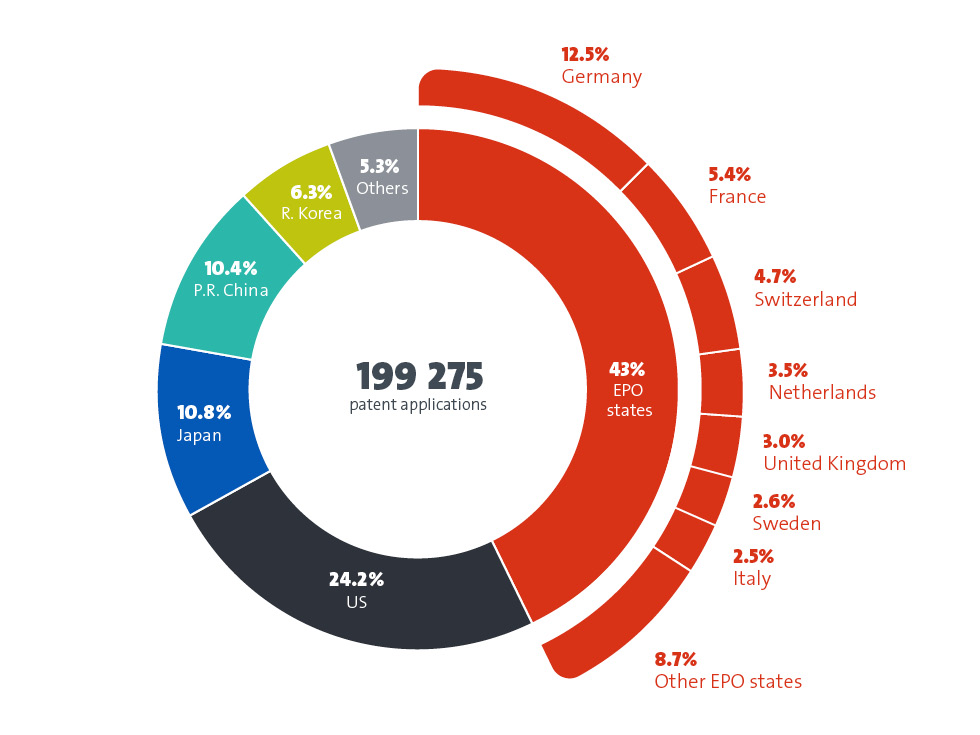
Geographic origin of applications
Filings from European applicants grew steadily (+1.8%), achieving a share of the total of 43.0%. German applicants continue to lead the way, with 12.5% of the total. Significant increases were seen from Finland (+9.2%), Spain (+6.9%), UK (+4.2%), Italy (+3.8%) and the Netherlands (+3.5%). Overall, the top five countries of origin for filings in 2023 were the United States (+0.4%), which accounts for almost a quarter of all applications, followed by Germany (+1.4%), Japan (-0.3%), P.R. China (+8.8%) and new top five entrant R. Korea (+21.0%). Switzerland remained the country with the most patent applications per capita.
Key figures summary
Check out the key trends in patenting for 2023.

More statistics for download
Data on the last 10 years and country specific profiles.